I was graciously given a partially completed BitX 17a kit by Thaire W2APF back in June, and I’ve been working on it slowly. The tests seem to be working out OK, and I’ve even gotten to use the oscilloscope and the tinySA a few times.
Here are a few notes on the IF filter measurement based on what I understand from the manual.
At this point you have the first opportunity to see the IF Filter passband. If you slowly tune the 12.96 MHz signal across the IF frequency range while monitoring RF voltage at the ungrounded end of R65 with an oscilloscope or an RF detection probe and voltmeter you can see the relative response at various frequencies. By recording the signal level at 200 Hz intervals and plotting this on graph paper you can generate a picture of the IF filter response curve. Unless you convert your voltage readings to log scale though they will look a bit rough. For a truly representative graph you need to convert your voltage readings to db.
It is possible to set the BFO frequency now. Once you know where the lower edge of the IF filter passband is located, you can calculate the 20 db point on that slope and set your BFO for that frequency. Alternatively, you can adjust the BFO so you can hear the zerobeat as you tune across the upper sideband but not hear it on the lower sideband. That will get you in the right area for later fine tuning on a signal being received from the antenna.
Input -18.5 dBm. Low output ON for signal. Mod None. Adjust frequency on tinySA by hand.
Measure VRMS on scope.
| Frequency, Hz | VRMS, mV | VRMS, dBm |
| 12,962,000 | 28 | -18.05 |
| 12,961,800 | 30 | -17.45 |
| 12,961,600 | 30 | -17.45 |
| 12,961,400 | 35 | -16.11 |
| 12,961,200 | 50 | -13.01 |
| 12,961,000 | 90 | -7.90 |
| 12,960,800 | 160 | -2.91 |
| 12,960,600 | 420 | 5.48 |
| 12,960,400 | 440 | 5.88 |
| 12,960,200 | 382 | 4.65 |
| 12,960,000 | 415 | 5.37 |
| 12,959,800 | 470 | 6.45 |
| 12,959,600 | 480 | 6.64 |
| 12,959,400 | 470 | 6.45 |
| 12,959,200 | 470 | 6.45 |
| 12,959,000 | 450 | 6.07 |
| 12,958,800 | 450 | 6.07 |
| 12,958,600 | 470 | 6.45 |
| 12,958,400 | 470 | 6.45 |
| 12,958,200 | 470 | 6.45 |
| 12,958,000 | 470 | 6.45 |
| 12,957,800 | 480 | 6.64 |
| 12,957,600 | 435 | 5.78 |
| 12,957,400 | 225 | 0.05 |
| 12,957,200 | 138 | -4.19 |
| 12,957,000 | 75 | -9.49 |
| 12,956,800 | 55 | -12.18 |
| 12,956,600 | 40 | -14.95 |
| 12,956,400 | 35 | -16.11 |
| 12,956,200 | 30 | -17.45 |
| 12,956,000 | 30 | -17.45 |
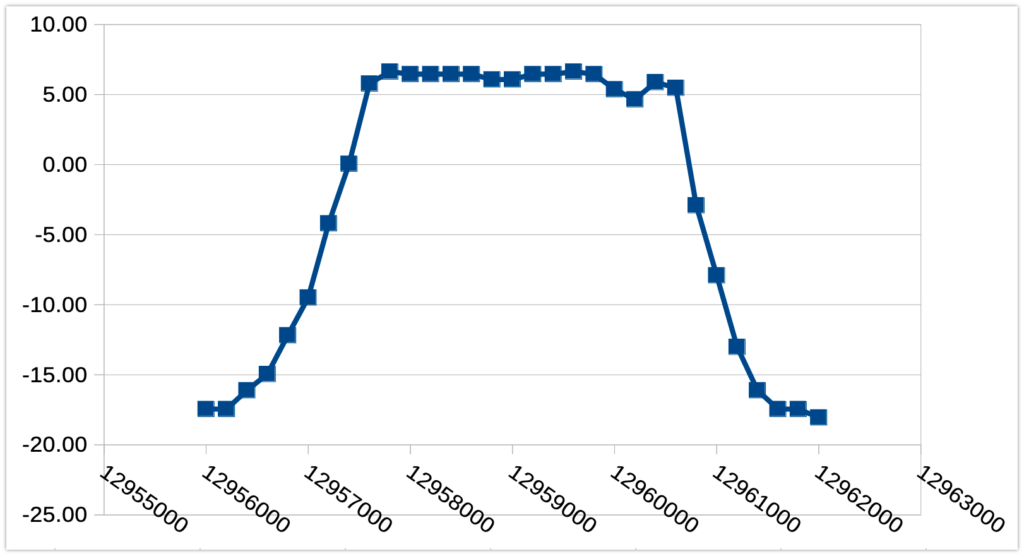
Lower edge of the passband appears to be at 12,957,600 Hz, which is 5.78 dBm. 20 dBm down from that is -14.22, which is at about 12,956,700 Hz. Let’s aim the BFO for that I guess.
Did I do this wrong? Please let me know!
@blog Looks reasonable. Good job on working through the details in setting this up and measuring all the frequency points. The filter response curve looks good. The amount of detail in executing this using a separate generator and measurement device highlights the value of a network analyzer (scaler or vector) such as a NanoVNA (or $$$ big-iron HP/Agilent gear). You might find that subtle impedance matching between the instruments and the filter changes the pass-band shape slightly. TNX & 73
Remote Reply
Original Comment URL
Your Profile
Why do I need to enter my profile?
This site is part of the ⁂ open social web, a network of interconnected social platforms (like Mastodon, Pixelfed, Friendica, and others). Unlike centralized social media, your account lives on a platform of your choice, and you can interact with people across different platforms.
By entering your profile, we can send you to your account where you can complete this action.
Thanks Gary! I have a nanoVNA and will have to try that too. I had an itch in my brain that I was doing this the hard way.